http://www.aiplab.com/Surface_Barrier_Width_3.html
/***********************************************
Graph Plot Program 2020.09.07 作成
************************************************
***********************************************************
Main Program の名称は void main( void ) です。
**********************************************************
NPLOT 個の graph を描きます。
NPLOT の値は NPLOT = 1 から 最大 NPLOT = 9 迄です。
for KPLOT = 0 A.html に出力します
for KPLOT = 1 A1.html に出力します、
for KPLOT = 2 A2.html に出力します、
......................................................................
for KPLOT = 9 A9.html に出力します。
**********************************************************
関数 PXPY( ) の中で Graphの各点の座標値を決定します。
for KPLOT =1 to NP and for i = 0 to N=10000 ;
各点の座標値は XP[KPLOT][i]、YP[KPLOT][i] に入ります。
0 < KPLOT < 10 とします。
***********************************************************/
#include <stdio.h>
#include <math.h>
/***************************************************
出力 File の 定義
fpAA に 計算結果 data が AA.txt に出力されます。
他のFile はグラフ描画の為の補助 file です。
この program を実行する為には必要なものです。
そのまま変更しないで一緒に加えて実行してください。
****************************************************/
FILE *fpAA;
FILE *fpC;
/**************************************************************/
/**************************************
Graph を NPLOT 個 描きます。
NPLOT の値は main で決めます。
**************************************/
/**************************************
各Graphの点の数は N個です。
N =10000 ;
**************************************/
char c ;
int N =10000 ;
double XP[10][10001],YP[10][10001];
int Ni,Nj,KPLOT,NPLOT;
double dxmin,dxmax,dymin,dymax,dyoffset,xaxis,yaxis;
/**************************************************
Graphの描画範囲(わく)の値を決定します
すなわち Graphの描画範囲を決定します。
xmin,xmax,ymin,ymax の値は PXPY( ) で決めます。
***************************************************/
double xmin,xmax,ymin,ymax;
double xx,yy;
int ixmin,ixmax,iymin,iymax;
int nxx ;
int nx1=100,nx2=600,nyy,ny1=50,ny2=1050 ;
int i,j,k,m;
double X,Y,A,B,S;
double kT,Esi,Np,Npp,Debye;
double R,Wo,Vo,WB,VB,No,WBWo,WoWB;
double dx,x;
/****************************************************/
/*******************************************
関数 PXPY( ) を定義して
Graphの各点の座標値を決定します。
for KPLOT =1 to NPLOT and for i = 0 to N,
各点の座標 XP[KPLOT][i]、YP[KPLOT][i] を決定します。
Graph を描いて html file に出力します。
KPLOT= 1 の時は A1.html に
KPLOT= 2 の時は A2.html に出力します。
..............................................
KPLOT= 9 の時は A9.html に出力します。
***************************************************/
/**********************************************************
Function void PXPY ( void ) を定義します。
***********************************************************/
void PXPY ( void ) {
/********** AA.txt に各関連定数を記録します****************/
fpAA=fopen("AA.txt","w");
fprintf(fpAA,"\n\n****ここでAA.txt に各関連定数を記録します****\n\n");
/********************************************************
NPLOT = 2 ;
グラフの値を決定します。
********************************************************/
fprintf( fpAA, "\n\n ********* KPLOT = % d ********\n\n",KPLOT);
kT = 0.0259;
Esi =648;
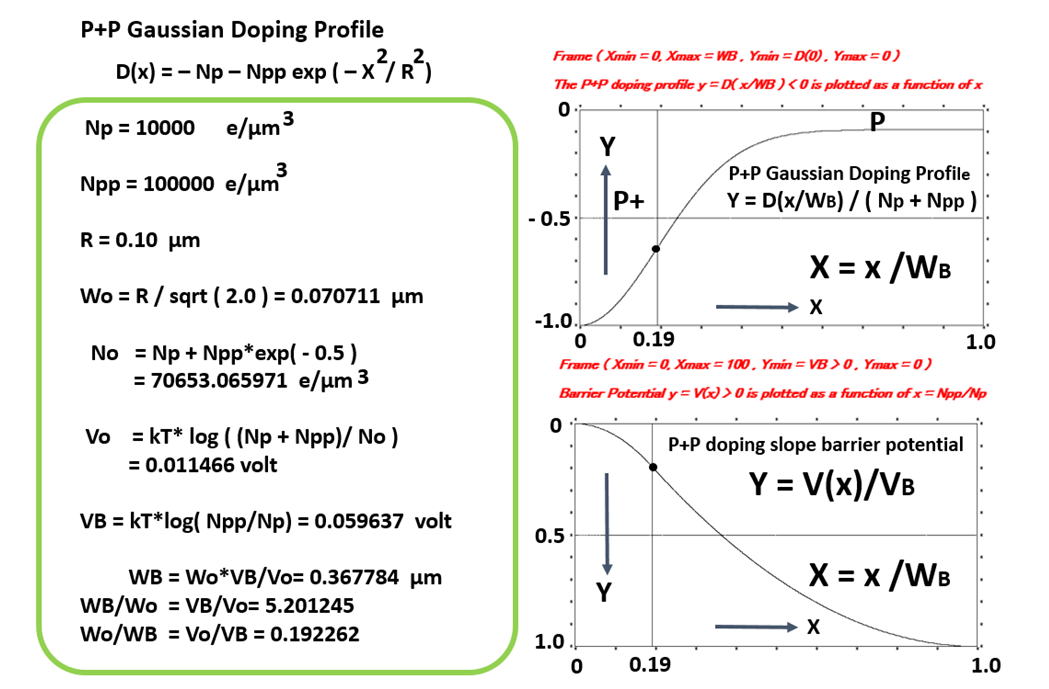
Np = 100; Debye = sqrt ( Esi*kT/Np) ;
fprintf(fpAA,"\n Debye = %f um for Np = ( 10 の14 乗 per cm の3乗 ) \n", Debye);
Np = 1000; Debye = sqrt ( Esi*kT/Np) ;
fprintf(fpAA,"\n Debye = %f um for Np = ( 10 の15 乗 per cm の3乗 ) \n", Debye);
Np = 10000; Debye = sqrt ( Esi*kT/Np) ;
fprintf(fpAA,"\n Debye = %f um for Np = ( 10 の16 乗 per cm の3乗 ) \n", Debye);
Np = 100000; Debye = sqrt ( Esi*kT/Np) ;
fprintf(fpAA,"\n Debye = %f um for Np = ( 10 の17 乗 per cm の3乗 ) \n", Debye);
Np = 1000000; Debye = sqrt ( Esi*kT/Np) ;
fprintf(fpAA,"\n Debye = %f um for Np = ( 10 の18 乗 per cm の3乗 ) \n", Debye);
Np = 10000000; Debye = sqrt ( Esi*kT/Np) ;
fprintf(fpAA,"\n Debye = %f um for Np = ( 10 の19 乗 per cm の3乗 ) \n", Debye);
Np = 10000;
fprintf(fpAA,"\n Np = %f \n",Np);
Npp = 100000;
fprintf(fpAA,"\n Npp = %f \n",Npp);
R = 0.1;
fprintf(fpAA,"\n R = %f \n",R);
Wo = R / sqrt ( 2.0 ) ;
fprintf(fpAA,"\n Wo = R / sqrt ( 2.0 ) = %f \n",Wo);
No = Np + Npp*exp( - 0.5 );
fprintf(fpAA,"\n No = Np + Npp*exp( - 0.5 ) = %f \n",No);
Vo = kT* log ( (Np + Npp)/ No ) ;
fprintf(fpAA,"\n Vo = kT* log ( (Np + Npp)/ No ) = %f \n",Vo);
VB = kT*log( Npp/Np) ;
fprintf(fpAA,"\n VB = kT*log( Npp/Np) = %f \n",VB);
WB = Wo*VB/Vo ;
fprintf(fpAA,"\n WB = Wo*VB/Vo= %f \n",WB);
WBWo = WB/Wo ;
fprintf(fpAA,"\n WB/Wo = VB/Vo= %f \n",WBWo );
WoWB = Wo/WB ;
fprintf(fpAA,"\n Wo/WB = Vo/VB = %f \n",WoWB );
dx = WB/N;
for ( i=0;i<N+1;i++) { x = i*dx;
if ( x < Wo ) { YP[1][i] = Vo*x*x/Wo/Wo; goto NEXT; }
YP[1][i] = VB - ( VB - Vo )*( WB - x ) * ( WB - x ) / ( WB - Wo )/( WB - Wo ) ;
NEXT: XP[1][i]= x / WB ; YP[1][i] = 1 - YP[1][i] /VB;
XP[2][i] = XP[1][i] ;
YP[2][i] = 1 - ( Npp* exp ( - x*x/R/R ) + Np ) / (Npp + Np ) ;
fprintf(fpAA,"\n XP[1][%d] = %f YP[1][%d] = %f YP[2][%d] = %f", i,XP[1][i],i,YP[1][i],i,YP[2][i]); }
fclose(fpAA); }
/******************************************
End of Function void PXPY ( void )
*********************************************/
/*******************************************
Graph を描いて html file に出力します
********************************************/
/******************************************
void Graph_Plot(void)
グラフ描画出力用の定義です。
*********************************************/
void Graph_Plot(void) {
if ( KPLOT == 0 ) fpC=fopen("A.html","w");
if ( KPLOT == 1 ) fpC=fopen("A1.html","w");
if ( KPLOT == 2 ) fpC=fopen("A2.html","w");
if ( KPLOT == 3 ) fpC=fopen("A3.html","w");
if ( KPLOT == 4 ) fpC=fopen("A4.html","w");
if ( KPLOT == 5 ) fpC=fopen("A5.html","w");
if ( KPLOT == 6 ) fpC=fopen("A6.html","w");
if ( KPLOT == 7 ) fpC=fopen("A7.html","w");
if ( KPLOT == 8 ) fpC=fopen("A8.html","w");
if ( KPLOT == 9 ) fpC=fopen("A9.html","w");
fprintf(fpC,"<!DOCTYPE HTML PUBLIC \"");
fprintf(fpC,"-//W3C//DTD HTML 4.01 Transitional//EN\">\n");
fprintf(fpC,"<HTML>\n<HEAD>\n<META http-equiv=\"Content-Type\"");
fprintf(fpC," content=\"text/html; charset=Shift_JIS\">\n");
fprintf(fpC,"<META http-equiv=\"Content-Style-Type\" content=\"text/css\">\n");
fprintf(fpC,"<TITLE></TITLE>\n</HEAD>\n<BODY>\n<BR>\n");
fprintf(fpC,"<BR>\n<FONT size=\"+2\"></FONT><I><B><FONT color=\"#ff0000\">\n\n");
if( KPLOT == 1 ) {
fprintf(fpC,"Frame ( Xmin = 0, Xmax = 100 , Ymin = VB > 0 , Ymax = 0 ) \n\n<BR><BR> " ) ;
fprintf(fpC," Barrier Potential y = V(x) > 0 is plotted as a function of x = Npp/Np \n\n<BR>" ) ; }
if( KPLOT == 2 ) {
fprintf(fpC,"Frame ( Xmin = 0, Xmax = WB , Ymin = D(0) , Ymax = 0 ) \n\n<BR><BR> " ) ;
fprintf(fpC," The P+P doping profile y = D( x/WB ) < 0 is plotted as a function of x \n\n<BR>" ) ; }
fprintf(fpC,"</FONT><BR><FONT color=\"#ff0000\">\n");
fprintf(fpC,"</FONT> <BR>\n</B><BR>\n</I><BR>\n");
/*******************************************************
グラフの枠 を描きます
*******************************************************/
for ( i =0 ; i<N; i++) {
if(i<2000) { xx = xmin ;
yy= ymin + ( 2000 - i )*( ymax - ymin)/2000; goto NEXTT;}
if(i<4000) { xx = xmax ;
yy = ymin + ( 4000 - i )*( ymax - ymin)/2000; goto NEXTT;}
if(i<6000) { yy = ymin ;
xx = xmin + ( 6000 - i )*( xmax - xmin)/2000;goto NEXTT;}
if(i<8000) { yy = ymax ;
xx = xmin + ( 8000 - i )*( xmax - xmin)/2000; goto NEXTT; }
if(i<9000) { yy = yaxis ;
xx = xmin + ( 9000 - i )*( xmax - xmin)/1000; goto NEXTT; }
xx = xaxis ;
yy= ymin + (10000 - i )*( ymax - ymin)/1000;
/********************************************************/
/**************************************************************
描画したい点 (xx,yy) のGraph 上での絶対座標 (nxx,nyy) の計算
**************************************************************/
NEXTT:
nyy = ny1 + (xx-xmin)*(ny2-ny1)/(xmax-xmin) ;
nxx = nx2 + (yy-ymin)*(nx1-nx2)/(ymax-ymin) ;
/**************************************************************/
fprintf(fpC,"<DIV style=\"top :");
fprintf(fpC,"%d",nxx) ;
fprintf(fpC,"px;left :") ;
fprintf(fpC,"%d",nyy);
fprintf(fpC,"px; position : absolute; z-index : 1;\" id=\"Layer1\"><P>");
fprintf(fpC,".");
fprintf(fpC,"</P></DIV>\n" ); }
/**************************************************************/
/*******************************************************
グラフのまわりの目盛りを描きます
*******************************************************/
for ( j = 0 ; j < Nj +1 ; j++) {
nxx = 100 + j*500/Nj + dyoffset ;
nyy = 50 - dymin;
fprintf(fpC,"<DIV style=\"top :");
fprintf(fpC,"%d",nxx) ;
fprintf(fpC,"px;left :") ;
fprintf(fpC,"%d",nyy);
fprintf(fpC,"px; position : absolute; z-index : 1;\" id=\"Layer1\"><P>");
fprintf(fpC,"*");
fprintf(fpC,"</P></DIV>\n" );
nyy = 1050+dymax ;
fprintf(fpC,"<DIV style=\"top :");
fprintf(fpC,"%d",nxx) ;
fprintf(fpC,"px;left :") ;
fprintf(fpC,"%d",nyy);
fprintf(fpC,"px; position : absolute; z-index : 1;\" id=\"Layer1\"><P>");
fprintf(fpC,"*");
fprintf(fpC,"</P></DIV>\n" ); }
for ( i = 0 ; i < Ni +1 ; i++) {
nyy = 50 + i*1000/Ni ;
nxx = 100 - dxmin;
fprintf(fpC,"<DIV style=\"top :");
fprintf(fpC,"%d",nxx) ;
fprintf(fpC,"px;left :") ;
fprintf(fpC,"%d",nyy);
fprintf(fpC,"px; position : absolute; z-index : 1;\" id=\"Layer1\"><P>");
fprintf(fpC,"*");
fprintf(fpC,"</P></DIV>\n" );
nxx = 600 + dxmax;
fprintf(fpC,"<DIV style=\"top :");
fprintf(fpC,"%d",nxx) ;
fprintf(fpC,"px;left :") ;
fprintf(fpC,"%d",nyy);
fprintf(fpC,"px; position : absolute; z-index : 1;\" id=\"Layer1\"><P>");
fprintf(fpC,"*");
fprintf(fpC,"</P></DIV>\n" ); }
/****************************************************************/
/*******************************************************
KPLOT 番目の Graph を描きます。
*******************************************************/
for ( i =0; i<N+1 ;i++) {
xx= XP[KPLOT][i];
yy= YP[KPLOT][i];
/**************************************************************
描画したい点 (xx,yy) のGraph 上での絶対座標 (nxx,nyy) の計算
**************************************************************/
nyy = ny1 + (xx-xmin)*(ny2-ny1)/(xmax-xmin) ;
nxx = nx2 + (yy-ymin)*(nx1-nx2)/(ymax-ymin) ;
/**************************************************************/
fprintf(fpC,"<DIV style=\"top :");
fprintf(fpC,"%d",nxx) ;
fprintf(fpC,"px;left :") ;
fprintf(fpC,"%d",nyy);
fprintf(fpC,"px; position : absolute; z-index : 1;\" id=\"Layer1\"><P>");
fprintf(fpC,".");
fprintf(fpC,"</P></DIV>\n" ); }
/**************************************************************/
fprintf(fpC,"</B></I></FONT>\n</BODY></HTML>\n");
fclose(fpC);
printf( "\n\n KPLOT = %d Push Enter Key >", KPLOT );
c=getchar( ); if(c =='c') printf("\n\n Good Bye ! \n\n");
c=getchar( ); if(c =='c') printf("\n\n Good Bye ! \n\n");
if ( KPLOT == 0 )
printf("\n\n ******* See A.html *******\n\n");
if ( KPLOT > 0 )
printf("\n\n ******* See A%d.html *******\n\n",KPLOT);
}/********* End of PXPY ( ) *****************/
/***********************************************************
Main Program の名称は void main( void ) です。
NPLOT 個の graph を描きます。
Graph を描いて html file に出力します。
KPLOT= 1 の時は A1.html に
KPLOT= 2 の時は A2.html に出力します。
..............................................
KPLOT= 9 の時は A9.html に出力します。
関数 PXPY( ) を定義し、Graphの各点の座標値を決定します。
for KPLOT =1 to NPLOT and for i = 0 to N,
各点の座標値は XP[KPLOT][i]、YP[KPLOT][i] に入ります。
***********************************************************/
void main( void ) {
NPLOT = 2;
PXPY( );
xmin = 0 ; xmax = 1; ymin = 0 ; ymax = 1;
Ni =10; Nj =10;
dxmin = 5 ; dxmax = 10 ; dymin = 10 ; dymax = 10 ;
dyoffset = 5;
KPLOT = 1 ; xaxis = Wo/WB ; yaxis = 0.5 ;
Graph_Plot( ) ;
KPLOT = 2 ; xaxis = Wo/WB ; yaxis = 0.5 ;
Graph_Plot( ) ;
/*******************************************
Program のすべての計算が完了しますと、
Standby 状態のなります。
最後に Enter Key を押すと
Programが終了します。
********************************************/
printf( "\n\n Push Enter Key to End >" );
c=getchar( ); if(c =='c') printf("\n\n Good Bye ! \n\n");
c=getchar( ); if(c =='c') printf("\n\n Good Bye ! \n\n"); }
/*************** END of Program Coding ****************/
return to http://www.aiplab.com